
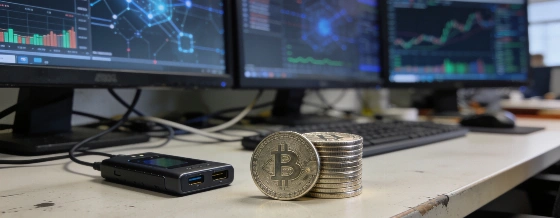
Crypto traders rely on a mix of on-chain analytics and technical charting platforms to interpret blockchain activity, price structure, and market sentiment. Understanding the strengths and limits of each tool is key to building a disciplined trading approach
Crypto traders today have access to a growing ecosystem of analytics platforms that help them interpret blockchain activity, price movements, and market sentiment. These tools generally fall into two main categories: on-chain data platforms, which extract metrics directly from public blockchains, and technical analysis (TA) platforms, which focus on price action, charting, and indicator-based strategy testing. Each serves a distinct purpose, and most experienced traders use both types to build a more complete view of the market.
On-Chain Data Platforms
On-chain analytics platforms such as Glassnode, CryptoQuant, and Santiment provide metrics that describe blockchain-level activity. These include exchange inflows and outflows, active address counts, large transaction activity, and holder distribution. For example, Glassnode tracks supply and balance changes across major networks, while CryptoQuant emphasizes exchange flows and whale behavior. Santiment combines on-chain data with social sentiment indicators. These platforms aim to quantify how assets move on-chain, offering insights into accumulation, distribution, and potential shifts in market structure.
It's important to note that on-chain metrics are descriptive, not predictive. A spike in exchange outflows might suggest long-term holders are moving assets to cold storage, but it could also reflect other motives. Similarly, an increase in active addresses may indicate growing user interest or simply more automated activity. Traders often use these metrics to contextualize price moves, but rarely treat any single indicator as a standalone trading signal.
Technical Analysis and Charting
Technical analysis platforms like TradingView, Coinigy, and Kattana focus on price, volume, and derived indicators. TradingView is widely used for its charting tools, custom scripting, and backtesting features. Coinigy aggregates data from multiple exchanges, while Kattana offers dashboards that combine centralized and decentralized market data. DexTools specializes in decentralized exchange (DEX) liquidity and token listings, and Token Terminal provides protocol-level financial metrics that blend fundamental and technical perspectives.
TA tools allow traders to analyze price structure, identify support and resistance, and test strategies using historical data. While these platforms excel at visualizing price action, their effectiveness depends on the quality of underlying market data and the parameters chosen for each indicator. Results can vary significantly across exchanges and assets, especially in thinly traded or newly listed tokens.
Combining Approaches and Managing Risks
Combining on-chain data with technical analysis can help traders form more robust hypotheses about market conditions. A typical workflow might start with an on-chain signal-such as rising exchange inflows-followed by a review of price structure for confirmation. Additional sentiment or derivatives data, like open interest or long/short ratios, can further refine the analysis. Backtesting these combinations using historical data helps assess whether the approach would have produced consistent outcomes in the past.
Yet, all crypto analytics tools come with limitations. Data quality, update frequency, and methodological transparency vary widely between providers. Some platforms do not fully disclose how they calculate key metrics, making it difficult to compare results. Market manipulation, such as wash trading, can distort both on-chain and exchange-based data, especially for low-liquidity assets. Free tiers often lag behind real-time activity and may restrict access to granular data or advanced features.
To avoid common mistakes, traders are advised to define their analytical questions before diving into the data, use multiple independent metrics, document their assumptions, and track the performance of their signals over time. Relying on a single indicator or unverified data source can lead to false confidence and poor decision-making.
Choosing the Right Tools
Selecting the right crypto trading tools depends on the intended use case. Key criteria include the type of data provided (raw on-chain metrics, derived signals, technical indicators), coverage of relevant blockchains and exchanges, availability of API access for automation, clarity of methodology, historical data depth, and cost structure. Free plans are often sufficient for basic exploration, but advanced research or automated strategies may require paid subscriptions for higher-resolution data and expanded features.
For those interested in automating recurring crypto purchases, platforms like Gate Auto Invest have introduced features that allow users to schedule regular buys and integrate with other earning products. While such tools can help implement strategies like dollar cost averaging, they do not guarantee profits and should be evaluated alongside other analytics platforms. For more details on automated crypto investing, see EgonCoin's coverage of how Gate Auto Invest supports recurring crypto purchases.
According to data from Glassnode and CryptoQuant, Bitcoin's on-chain exchange flows and active address counts have shown significant fluctuations during periods of heightened market volatility. For example, during the March 2024 market correction, Glassnode reported a sharp increase in exchange inflows, while active addresses on the Bitcoin network rose to their highest weekly average since late 2021. These metrics, when combined with technical chart patterns, provided traders with additional context for interpreting price swings and potential liquidity shifts.
Understanding the strengths and weaknesses of each analytics platform-and how to combine them-remains essential for anyone seeking to navigate the complexities of crypto markets. No single tool or indicator can capture the full picture, and disciplined analysis requires cross-checking data, questioning assumptions, and staying alert to methodological differences and market manipulation risks.
On-chain data platforms and technical analysis tools each offer a different lens on crypto markets. On-chain analytics reveal blockchain-level activity, such as asset flows and holder behavior, while technical analysis focuses on price action and historical patterns. Used together, they can help traders and analysts build a more nuanced understanding of market dynamics, but only when their limitations are recognized and their outputs are interpreted with care.